
The official source for GPA × MCAT acceptance rates is AAMC Table A-23, which reports three numbers in every cell: total applicants in that bracket, total acceptees, and the resulting acceptance rate. Each row represents an undergraduate GPA band; each column represents an MCAT total score band. The grid aggregates multiple application cycles and suppresses any cell where fewer than 10 applicants fall in that bracket, replacing it with a dash.
One tool that reproduces the AAMC grid reports 155,940 applicants and 70,289 acceptees across three aggregated cycles, giving you a sense of the data volume behind each cell. That scale matters: a cell with 800 applicants carries real statistical weight; a cell with 12 does not.
The practical takeaway is this: use the grid to estimate bracket-level odds, then layer in per-school medians and mission fit before finalizing any list.
Key Takeaways
The GPA MCAT grid gives you bracket-level acceptance odds, not school-specific predictions, and it works best when paired with per-school medians and a clear tier classification system.
| Point | Details |
|---|---|
| Grid is bracket-level only | AAMC Table A-23 shows aggregate rates across all schools, not any single program’s odds. |
| Always check sample size | Cells with fewer than 10 applicants are suppressed; treat any cell under 30 applicants as low-confidence. |
| MCAT compensates within limits | A strong MCAT can offset modest GPA weaknesses, but below a 3.0 UGPA the compensation is very limited. |
| Medians plus mission fit drive choices | Use per-school medians from MSAR or school pages alongside grid rates to classify safety, target, and reach schools. |
| Medschoolpilot automates the analysis | The readiness tracker maps your GPA and MCAT to school medians and builds a tiered list with deadline tracking. |
Table of Contents
- How to read the GPA MCAT grid correctly
- The AAMC acceptance-rate grid: what the data shows
- Where to find per-school median MCAT and GPA data
- How to build a safety/target/reach list from the grid
- A worked example with a downloadable worksheet
- Limitations and common mistakes when using the grid
- What the data actually tells you about your chances
- Medschoolpilot makes the grid analysis automatic
- Primary sources and datasets to consult
- Sources
How to read the GPA MCAT grid correctly
The grid’s structure is straightforward once you know what each axis controls. Rows run from the lowest UGPA band (below 2.20) up to the highest (3.80 and above). Columns run from the lowest MCAT band (below 486) to the highest (517–528). The cell at the intersection of your GPA row and MCAT column shows how applicants in that exact bracket performed historically.
What each cell contains:
- Number of applicants in that GPA × MCAT bracket
- Number of those applicants who received at least one acceptance
- Acceptance rate (acceptees ÷ applicants, expressed as a percentage)
Dashed and blank cells appear when fewer than 10 applicants fall in a bracket. AAMC suppresses those cells to protect individual privacy and because a rate calculated from 3 or 4 people is statistically meaningless. If your bracket is suppressed, you need to look at adjacent cells and treat any estimate as rough.
MCAT definition in the grid: AAMC uses only the most recent MCAT score for each applicant, not the highest or an average. If you retook the exam, the grid reflects your latest attempt regardless of whether it went up or down.
GPA definitions: The grid uses undergraduate GPA (UGPA) as reported through AMCAS. That is distinct from your science GPA (BCPM), which covers Biology, Chemistry, Physics, and Math courses only. Schools often screen on both, but the grid rows correspond to overall UGPA. For a detailed breakdown of how science GPA is calculated, that distinction matters when your overall and BCPM GPAs diverge significantly.
Pro Tip: *Before treating any cell’s acceptance rate as a decision threshold, check the applicant count.
The AAMC acceptance-rate grid: what the data shows
The table below reproduces representative cells from the aggregated AAMC grid, organized by MCAT band (columns) and UGPA band (rows). Dashes indicate suppressed cells (n < 10). These figures come from AAMC Table A-23 as aggregated across multiple cycles.
Ranges shown are approximate bracket-level estimates derived from aggregated AAMC data. Individual cycle values vary. Download the full grid directly from the AAMC MCAT/GPA tools page for exact figures.
A few patterns stand out immediately. Acceptance rates climb steeply as you move right (higher MCAT) and upward (higher GPA), but the gains are not linear. Moving from a 3.40 GPA and a 504 MCAT to a 3.60 GPA and a 508 MCAT roughly doubles your bracket-level odds. Moving from a 515 to a 519 MCAT when your GPA is already 3.80 adds far less.
Pro Tip: Download the raw CSV from TestPrepPal’s acceptance calculator and sort by your GPA band to see your entire MCAT column at once. It’s faster than scanning the PDF.
Where to find per-school median MCAT and GPA data
The grid tells you aggregate odds. Per-school medians tell you what the admitted class at a specific program actually looked like. Those are two different questions, and you need both.
Primary sources for per-school medians:
- MSAR (Medical School Admission Requirements): AAMC’s paid database covers all MD-granting LCME-accredited schools and reports median MCAT, median GPA, 10th and 90th percentile ranges, and in-state vs. out-of-state breakdowns. It is the most complete single source for MD programs.
- Individual school admissions pages: Programs like UAB School of Medicine, University of Arizona College of Medicine, and Mayo Clinic Alix School of Medicine publish their own entering-class statistics. When a school’s own page conflicts with a third-party table, trust the school’s page.
- ProspectiveDoctor and Shemmassian Consulting compile per-school median tables that are useful for quick comparisons across dozens of programs. Both draw from MSAR and school-reported data, so treat them as convenient aggregators rather than primary sources.
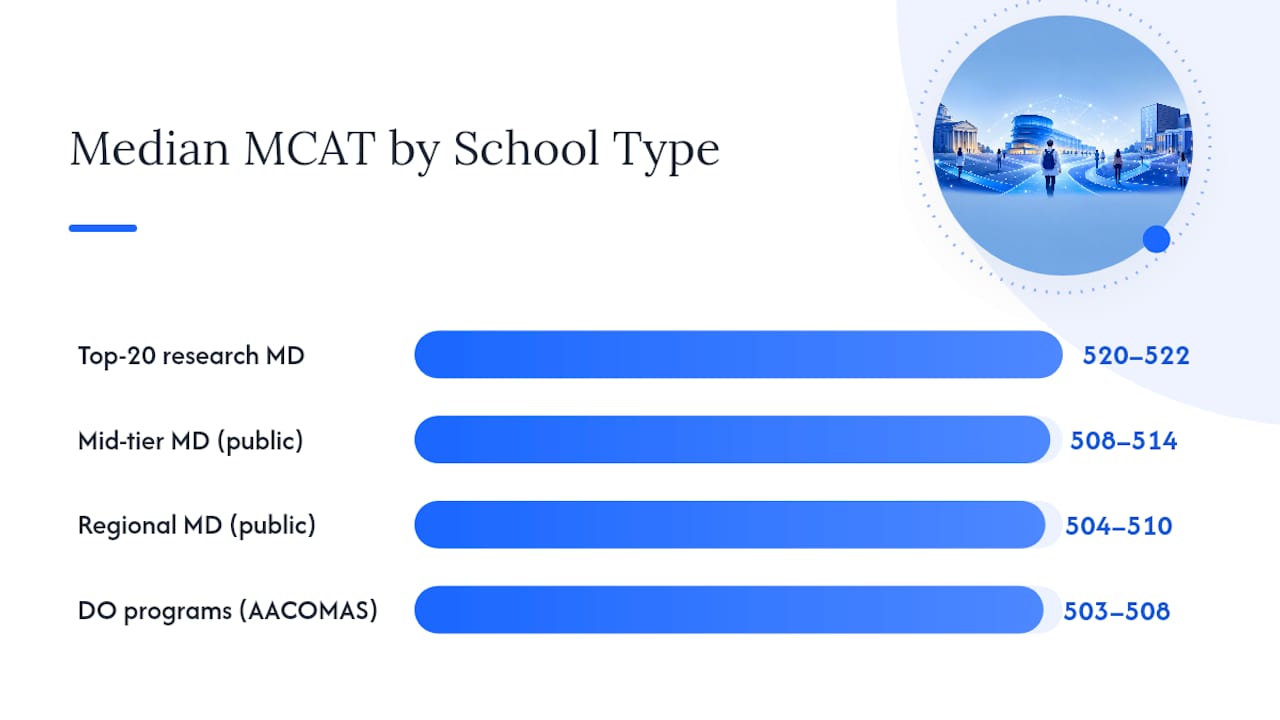
Recent aggregated reporting puts the average matriculant GPA near 3.75 and average MCAT near 511.9, but those are national averages across all MD programs. Individual school medians vary considerably: a regional public school may matriculate students with a median MCAT of 508 and a 3.65 GPA, while a top-20 research program may sit at 520 and 3.90.
Representative per-school median snapshot (illustrative, verify on school sites):
| School Type | Median MCAT | Median UGPA | In-State Advantage |
|---|---|---|---|
| Top-20 research MD | 520–522 | 3.85–3.92 | Minimal (private) |
| Mid-tier MD (public) | 508–514 | 3.65–3.78 | Significant |
| Regional MD (public) | 504–510 | 3.55–3.70 | Significant |
| DO programs (AACOMAS) | 503–508 | 3.50–3.65 | Moderate |
Always verify on the school’s own admissions page or MSAR before using these figures in decisions. For a deeper look at how AMCAS and AACOMAS handle GPA reporting differently, that distinction affects how your numbers appear to each school type.
Pro Tip: When a school lists a median rather than a mean, half the admitted class scored below that number. A 512 median does not mean 512 is the floor. Students with 508s get in regularly at programs where the median is 512.
How to build a safety/target/reach list from the grid
This is where the grid becomes a practical tool rather than an interesting table.
Step 1: Identify your GPA bands. Find your overall UGPA row and note your BCPM separately. If they differ by more than 0.3 points, flag it — schools will see both.
Step 2: Find your MCAT band. Use your most recent score, since that is what AAMC reports in the grid. If you are planning a retake, run the analysis for both your current score and your realistic target.
Step 3: Read your grid cell. Note the acceptance rate and the applicant count; for applicants seeking accommodations, understanding detailed documentation requirements is important as outlined in LSAC Required Paperwork for Disability Accommodations. If the count is below 30, treat the rate as low-confidence and look at adjacent cells to bracket the range.
Step 4: Compare to school medians. Pull each target school’s median MCAT and GPA from MSAR or the school’s admissions page. Then apply these classification rules:
- Safety: Your stats sit at or above the school’s 75th percentile for both GPA and MCAT, and your grid cell acceptance rate exceeds 40%.
- Target: Your stats are near the school’s median (within roughly 0.2 GPA points and 3 MCAT points), and your grid cell acceptance rate falls between 20–40%.
- Reach: Your stats fall below the school’s median on at least one metric, or your grid cell acceptance rate is below 20%.
Step 5: Check mission fit. A school with a rural-medicine focus, a research-heavy curriculum, or a specific underserved-community mission will weight non-stat factors heavily. A 515 MCAT does not guarantee an interview at a school whose mission your application does not address.
Worked example: Applicant with a 3.55 UGPA and a 513 MCAT. That is a solid bracket. Now compare to specific schools: a regional public MD with a median of 510 / 3.65 is a target (GPA slightly below median, MCAT above). A top-20 program with a median of 521 / 3.90 is a reach. A DO program with a median of 505 / 3.55 is a safety. For more on navigating a low GPA with a high MCAT, the compensation dynamics shift the list meaningfully.

Pro Tip: Weight the percentile spread, not just the median. A school where the 10th percentile MCAT is 504 and the 90th is 522 has a wide range and is more accessible than a school where both percentiles sit within 4 points of each other.
A worked example with a downloadable worksheet
Sample profile: 3.35 UGPA, 3.20 BCPM, 513 MCAT (most recent).
| Input | Value | Grid/Median Action |
|---|---|---|
| UGPA band | 3.20–3.38 | Row: 3.20–3.38 |
| MCAT band | 512–515 | Column: 512–515 |
| Grid cell acceptance rate | ~30–40% | Moderate; check n |
| BCPM gap | 0.15 below UGPA | Flag for schools with BCPM screens |
| Target school median | 510 / 3.55 | GPA below median; MCAT above |
| Classification | Target/Reach | Apply; strengthen non-stats |
The GPA-MCAT tradeoff analysis confirms that a 513 MCAT can partially compensate for a 3.35 GPA, but only at schools where the mission and class profile allow for that flexibility. Below a 3.0 UGPA, the MCAT’s compensatory power drops sharply regardless of score.
To build your own worksheet:
- Create a spreadsheet with columns: School Name, School Median MCAT, School Median GPA, Your MCAT, Your GPA, Grid Cell Rate, Applicant Count, Classification.
- Pull school medians from MSAR or individual admissions pages.
- Enter your grid cell rate from the AAMC table for your bracket.
- Flag any cell where the applicant count is below 30 as “low confidence.”
- Apply the safety/target/reach rules from the previous section.
- Add a mission-fit column (1–3 scale) and weight it alongside stats.
Limitation: This worksheet uses historical aggregated rates. It does not predict any individual school’s decision, and it cannot account for year-to-year variation in applicant pool competitiveness. Treat every output as a probabilistic signal, not a guarantee.
For a broader look at medical schools by MCAT data, that resource maps school-level stats across the full MD landscape and pairs well with this worksheet.
Limitations and common mistakes when using the grid
The grid is powerful precisely because it is based on real applicant data. It is also easy to misuse.
Common mistakes:
- Treating medians as cutoffs. A school’s median MCAT of 512 does not mean 511 is rejected. Roughly half the admitted class scored below the median. Committees read whole applications.
- Ignoring sample-size suppression. A dashed cell means the data does not exist in usable form. Guessing at a rate from adjacent cells is fine for rough orientation; making a school-list decision on it is not.
- Overlooking science GPA. Your BCPM can be meaningfully lower than your overall GPA if you took many non-science courses. Schools screen on both, and a 3.70 overall with a 3.30 BCPM will raise flags at research-heavy programs.
- Misreading aggregate rates as school-specific odds. A 35% acceptance rate in your grid cell is the rate across all U.S. MD programs in that bracket. The rate at any single school in that bracket could be 5% or 60%.
- Ignoring section score imbalances. A 513 total with a 124 in Chemical and Physical Foundations reads differently than a 513 with balanced 128s. Some schools screen by section.
Holistic review is real. AAMC’s institutional tools for schools include Student Success Reports that link admissions metrics to downstream outcomes like USMLE performance and remediation rates. Schools use these internally to set thresholds, which means their actual screens may differ from what any public median suggests.
On the MCAT side, gains yield diminishing returns above roughly 515–518. If you are already at 516 and considering a retake to hit 520, the marginal admissions benefit at most non-top-20 programs is small. A stronger personal statement or additional clinical hours may move the needle more.
Pro Tip: If your grid cell has a small n, look at the cells immediately above and below your GPA band in the same MCAT column. The true rate for your bracket likely falls somewhere between those two adjacent cells.
What the data actually tells you about your chances
The GPA × MCAT grid is the most honest tool premeds have access to, and most applicants underuse it. They look up their bracket once, feel either relieved or discouraged, and move on. The smarter move is to run the analysis twice: once with your current stats and once with a realistic improved MCAT or post-bacc GPA scenario, then compare how the school-list composition changes.
A few things the data consistently shows that conventional premed advice glosses over: MCAT improvements in the 504–515 range produce the largest bracket jumps. Above 515, the gains are real but smaller, and diminishing returns set in around 515–518 for most non-top-20 programs. Below a 3.0 GPA, a high MCAT helps but cannot fully compensate, and a post-bacc or SMP becomes a more credible signal to committees than another MCAT attempt.
Diversify tiers deliberately. A list of 15 reaches and 2 safeties is not a strategy. Aim for a distribution where at least 4–5 schools sit in your target bracket and 3–4 are genuine safeties by the numeric rules above. If your stats fall below key thresholds (roughly 3.0 UGPA or below 500 MCAT), plan a backup timeline before submitting rather than after your first cycle.
Medschoolpilot’s readiness tracker automates the steps above, mapping your GPA and MCAT to school medians and flagging where your profile sits relative to each program’s published data. It does not replace the qualitative judgment the grid cannot capture, but it removes the spreadsheet work so you can focus on the application itself.
Medschoolpilot makes the grid analysis automatic
Pulling grid cells, cross-referencing school medians, and classifying 20 programs into tiers takes hours in a spreadsheet. Medschoolpilot does it in minutes.

The readiness tracker imports your GPA and MCAT, maps them against per-school medians, and builds a tiered school list with deadline tracking built in. You can log clinical hours, research time, and volunteering alongside your stats so your entire application picture lives in one place. The tool complements the grid analysis above; it does not replace the qualitative review that mission fit and personal statement require. Start your free trial at Medschoolpilot and see your school list take shape from your actual numbers.
Primary sources and datasets to consult
These are the authoritative resources behind every figure in this article. Bookmark them and return when you update your stats or build a new school list.
- AAMC Table A-23: The official multi-cycle acceptance-rate grid by MCAT and UGPA band. Primary source for all bracket-level rates; download the PDF directly.
- AAMC MCAT/GPA Tools for Admissions Officers: Includes the MCAT/GPA Thresholds Explorer and Student Success Reports. Shows how schools model thresholds internally.
- TestPrepPal Acceptance Calculator: Reproduces AAMC grid data with a downloadable CSV and heatmap view. Useful for quick bracket lookups; verify against the official table for precision.
- ResidencyAdvisor GPA-MCAT Tradeoff Analysis: Data-driven breakdown of where MCAT can and cannot compensate for GPA weaknesses.
- JackWestin MCAT vs. GPA Guide: Practical interpretive guidance on diminishing returns above 515–518 and how to read combined stats.
- UAB School of Medicine Admissions: Example of a school-published admissions page with program-level stats.
- University of Arizona College of Medicine Admissions: Another primary source for verifying school-reported medians.
- Mayo Clinic Alix School of Medicine: Official program page with prerequisites and admissions context.
- ProspectiveDoctor and Shemmassian Consulting: Third-party aggregators for per-school median tables. Useful for quick comparisons; prefer school-reported data when the two conflict.
- Medschoolpilot Premed Articles: Data-driven guides on MCAT, GPA, and application strategy for premeds at every stage.
Sources
How AAMC calculates Table A-23:
Primary datasets used in this article:
The 155,940 applicants and 70,289 acceptees reported across three aggregated cycles give the grid its statistical depth. Third-party tools that reproduce this data may use slightly different aggregation windows, which can shift individual cell rates by a few percentage points. When precision matters, go back to the official AAMC table.