
The shortest answer: if you’re applying as a nonresident, your best-positioned targets include University of Colorado School of Medicine, University of Vermont College of Medicine, Eastern Virginia Medical School, Boston University School of Medicine, Baylor College of Medicine, Tulane University School of Medicine, Stanford University School of Medicine, and Ohio State University College of Medicine. Several public schools on this list have reported high out-of-state matriculant shares in recent class profiles. Your single next step: pull each school’s class profile on MSAR/AAMC and log them in a readiness tracker before you finalize your list.
Quick shortlist with the one-line reason for each pick:
- University of Colorado School of Medicine — public flagship with one of the highest reported OOS matriculant shares among state schools
- University of Vermont College of Medicine — public school with high nonresident representation relative to most state peers
- Eastern Virginia Medical School — smaller class, but historically many interview slots go to nonresidents
- Boston University School of Medicine — private, recruits nationally, tuition is uniform regardless of state
- Baylor College of Medicine — private funding means residency carries less weight than at Texas public schools
- Tulane University School of Medicine — private with consistent OOS matriculant representation across recent cycles
- Stanford University School of Medicine — elite private, national applicant pool, residency status rarely a factor
- Ohio State University College of Medicine — large class and broad national recruitment increase OOS interview volume
- University of Michigan Medical School — top-ranked public with meaningful OOS enrollment
- University of Virginia School of Medicine — public research school with substantial nonresident interview and matriculant share
- Oregon Health & Science University School of Medicine — primary care focus, solid OOS enrollment signals
- University of South Florida Morsani College of Medicine — public with comparatively competitive OOS tuition noted in published summaries
Add these to your tracked school list now. Verify each one’s current class profile before submitting secondaries.
Table of Contents
- Which out-of-state friendly med schools should you compare first?
- How do you identify more OOS-friendly schools on your own?
- What data sources should you actually trust for OOS figures?
- Key Takeaways
- The OOS percentage is a starting point, not a verdict
- Medschoolpilot keeps your OOS school list from falling apart
- Authoritative sources for OOS figures and class profiles
Which out-of-state friendly med schools should you compare first?
The table below covers all 18 schools the article examines. Selectivity figures come from published class profiles and aggregated sources; treat them as directional, not exact, since medians shift each cycle. Check MSAR for the most current year’s data.

| School | Public / Private | % OOS Signal | Tuition Shape (OOS vs In-State) | Selectivity Signal | Class Size (approx.) | Notes / Admissions Quirks |
|---|---|---|---|---|---|---|
| University of Colorado School of Medicine | Public | Very high; reports of a majority out-of-state matriculants in some class summaries | Significant OOS premium | Competitive | — | High OOS share is policy-driven, not a population artifact |
| University of Vermont College of Medicine | Public | High nonresident share vs. state peers | OOS premium applies | Competitive | — | Consistently cited on OOS-friendly public lists |
| Eastern Virginia Medical School | Public | High OOS interview and matriculant rate | OOS premium applies | Median GPA ~3.66, MCAT ~32 equivalent | — | Smaller class; many interview slots go to nonresidents |
| Boston University School of Medicine | Private | High; recruits nationally | Uniform tuition (no in-state rate) | Competitive | — | No residency preference by design |
| Baylor College of Medicine | Private | High; national pool | Uniform tuition | Highly competitive | — | Private model; Texas public caps do not apply |
| Tulane University School of Medicine | Private | Consistent OOS representation | Uniform tuition | Competitive | — | Private admission model; strong regional and national ties |
| Stanford University School of Medicine | Private | Large OOS share; elite national pool | Uniform tuition | Highly selective | — | Residency status carries minimal weight |
| Ohio State University College of Medicine | Public | Large OOS enrollment due to class size | OOS premium applies | Competitive | — | Large class increases raw OOS interview and admit volume |
| University of Michigan Medical School | Public | Sizeable OOS share for a flagship public | OOS premium applies | Highly competitive | — | Top-ranked public with national recruitment |
| University of Virginia School of Medicine | Public | Substantial OOS interview and matriculant share | OOS premium applies | Competitive | — | In-state and OOS profiles are relatively similar vs. peers |
| West Virginia University School of Medicine | Public | High OOS share; multi-campus model | OOS premium applies | Moderate | — | Regional campus system; history of admitting many nonresidents |
| University of Iowa Carver College of Medicine | Public | Reliable nonresident share in class profiles | OOS premium applies | Competitive | — | Solid selectivity; national applicant pool |
| Pennsylvania State University College of Medicine | Public | Meaningful nonresident enrollment | OOS premium applies | Competitive | — | Middle ground between flagship publics and privates |
| University of Missouri-Kansas City School of Medicine | Public | Notable OOS interview representation | Large OOS premium | Moderate | — | 6-year BA/MD program; unique structure |
| Oregon Health & Science University School of Medicine | Public | Solid OOS enrollment signals | OOS premium applies | Competitive | — | Primary care focus; WWAMI regional compact applies |
| University of South Florida Morsani College of Medicine | Public | Relatively high OOS enrollment | Competitive OOS tuition noted | Competitive | — | OOS tuition comparatively lower per published summaries |
| University of Arizona College of Medicine – Phoenix | Public | Large nonresident share; reclassification documented | OOS premium; reclassification possible | Competitive | — | Residency reclassification after matriculation is a documented path |
| UCLA David Geffen School of Medicine | Public (UC system) | Significant OOS presence for a UC school | OOS premium applies | Highly selective | — | UC system; highly selective; national applicant pool |
A few schools deserve a closer look beyond the table summary.
University of Colorado sits at the top of most OOS-friendly public lists for good reason. Its reported nonresident share is policy-driven rather than a statistical artifact, and it pairs that with competitive financial aid signals for nonresidents.
Eastern Virginia Medical School is the sleeper pick. The class is small, but published class-profile data shows a median GPA around 3.66 and an MCAT equivalent near 32, which is more accessible than many flagship publics. Nonresidents fill a disproportionate share of interview slots relative to class size.
Baylor College of Medicine is worth separating from the Texas public schools entirely. Texas public medical schools operate under admissions policies that heavily restrict OOS seats. Baylor, as a private institution, is not subject to those caps.
Oregon Health & Science University carries a caveat: the WWAMI regional compact gives priority to applicants from Washington, Wyoming, Alaska, Montana, and Idaho. Those applicants are treated similarly to in-state applicants for admissions, which can inflate the apparent OOS share if you’re counting WWAMI-state residents as “out of state.”
University of Missouri-Kansas City runs a six-year BA/MD program, which changes the applicant pool entirely. The OOS interview representation is real, but the structure is unlike a standard four-year MD program.
Statistic callout: SmarterPremed’s OOS Welcome Mat flags Washington D.C. medical schools as showing roughly 98% OOS representation, driven almost entirely by D.C.'s small resident population rather than any institutional preference for nonresidents.
How do you identify more OOS-friendly schools on your own?
The shortlist above covers the most commonly cited programs, but your application strategy should extend beyond it. Here’s a repeatable vetting process.
Step-by-step: how to vet a school for OOS friendliness
- Pull the school’s class profile on MSAR/AAMC. Look for the “matriculant state of residence” breakdown. A school where nonresidents make up 30% or more of the entering class is a meaningful signal.
- Check whether the school is public or private. Private schools generally recruit nationally and show higher OOS representation by design. Public schools vary widely, and some states cap OOS enrollment by law.
- Look for regional compact language. WWAMI, WICHE, and similar agreements reclassify certain out-of-state applicants as in-region. If you’re from a compact state, this helps you. If you’re not, it means the apparent OOS share is partly made up of compact-state applicants who aren’t truly competing as nonresidents.
- Check the residency reclassification policy. Several public schools allow students to apply for in-state tuition after establishing domicile in the first year. At some programs, this can reduce later-year tuition by tens of thousands of dollars.
- Compare OOS tuition against average financial aid for nonresidents. A school with a high OOS share but no merit aid for nonresidents may still be financially punishing. USF Morsani and University of Arizona Phoenix are worth checking specifically for this.
- Look at the median matriculant GPA and MCAT. Use MCAT admissions data to calibrate whether your profile is competitive at each target. A school that admits many OOS applicants but at a median MCAT of 520 is not a safety.
- Check interview invite patterns. If a school doesn’t publish residency-specific acceptance rates, the geographic diversity of its interview pool is a useful proxy. Admissions forums and aggregated data tools can surface this.
Checklist: questions to ask or address in secondaries
- Does the school’s mission emphasize serving a specific state or region? If yes, what’s your connection to that mission?
- Does the school have a rural medicine track, underserved community focus, or research pipeline that aligns with your background?
- Can you articulate a specific reason for choosing this state or program beyond “I want to go to medical school”?
Addressing fit with a school’s mission in your secondary is one of the most direct ways to offset the residency disadvantage. A letter of intent or interest after an interview can reinforce that connection.
Pro Tip: Build a simple scoring matrix in your tracker: weight each OOS target by (1) your estimated admit probability based on GPA/MCAT vs. median, (2) four-year cost after any reclassification or aid, and (3) mission fit. Schools that score well on all three are your priority secondaries.
What data sources should you actually trust for OOS figures?
Most “OOS-friendly” lists you find online are built from a mix of official class profiles, inferred estimates, and aggregated forum data. The methodology matters.
Common pitfalls to watch for:
- WWAMI and regional compact inflation. OHSU’s OOS share looks high until you realize WWAMI-state applicants are treated as in-region. The same logic applies to any school in a compact state. Always check whether the school participates in a regional agreement before treating its OOS percentage as a true open-door signal.
- D.C. school statistics. As SmarterPremed notes, D.C. schools show near-100% OOS representation because D.C.'s resident population is tiny. That’s a population artifact, not a policy signal.
- Newly accredited schools. Programs that received accreditation recently may have incomplete or unrepresentative class-profile data. Their OOS percentages can swing dramatically from one cycle to the next.
- Texas public schools. State admissions policy at Texas public medical schools heavily restricts OOS seats. If a list includes UT Southwestern or UT Health San Antonio as OOS-friendly, treat that claim skeptically.
- Aggregator methodology gaps. BeMo, ProspectiveDoctor, and similar sites use different methods to estimate OOS acceptance rates. Some infer figures when schools don’t publish residency-specific data. Always trace a percentage back to its source and year.
Sources to use, in order of authority:
- MSAR (AAMC Medical School Admissions Requirements) — the gold standard. Paid access, but it gives you matriculant state-of-residence breakdowns, median GPA/MCAT, and class size for every LCME-accredited school.
- Individual school class profiles — most schools publish an annual class profile on their admissions page. These are free and usually include a state-of-residence map or table.
- State tuition and residency policy pages — for reclassification rules and OOS tuition rates, go directly to the school’s bursar or financial aid page, not a third-party summary.
- SmarterPremed OOS Welcome Mat — a useful quick-check tool that flags anomalies like D.C. schools and compact-state distortions. Use it as a filter, not a final answer.
Methodology note for this article: Every school on the shortlist was identified using published class profiles and aggregated sources (AAMC/MSAR, ProspectiveDoctor, Premed Catalyst). Where a specific percentage is cited, the source and context are linked. Schools where the OOS signal is driven by a population artifact or regional compact are flagged explicitly.
Pro Tip: If a school’s OOS percentage is missing or ambiguous in MSAR, look at the matriculant state-of-residence map in its published class profile. A map showing strong geographic diversity across 20+ states is a reliable proxy for genuine OOS friendliness, even without a hard percentage.
Key Takeaways
Private schools and a handful of public flagships consistently admit the largest shares of out-of-state students, but verifying each school’s class profile, regional compact status, and residency reclassification policy is the only way to build a list that holds up under scrutiny.
| Point | Details |
|---|---|
| Private schools lead on OOS access | Private programs like Baylor, Tulane, Stanford, and Boston University recruit nationally with no in-state preference by design. |
| Public OOS leaders are specific | University of Colorado, UVM, EVMS, and Ohio State are the public schools with the strongest documented OOS signals. |
| Regional compacts distort the data | WWAMI and similar agreements reclassify compact-state applicants as in-region; always check before counting a school’s OOS share. |
| Reclassification can cut costs sharply | Several public schools allow residency reclassification after year one, potentially reducing tuition by tens of thousands of dollars. |
| Medschoolpilot centralizes OOS tracking | Medschoolpilot’s school-list and readiness-tracking tools help you log residency rules, tuition notes, and class-profile sources in one place. |
The OOS percentage is a starting point, not a verdict
Most premeds treat a high OOS percentage as the finish line. It isn’t. The percentage tells you a school is willing to admit nonresidents. It says nothing about whether your specific profile is competitive there, whether the mission fits your background, or whether the four-year cost is survivable.
The applicants who use OOS data well are the ones who treat it as a filter, not a ranking. They pull the class profile, check the median GPA and MCAT, read the mission statement, and then ask a harder question: “Is there a real reason I belong at this school, or am I just applying because the door is open?”
That second question matters more than most premeds realize. Admissions committees at OOS-friendly schools still read secondaries carefully. A nonresident who can articulate a specific connection to the school’s mission, a rural medicine track, or a community health program in that state will consistently outperform a nonresident who is simply casting a wide net.
The cost question is equally underweighted. A school that admits 55% OOS applicants but charges $65,000 per year in nonresident tuition with no merit aid for nonresidents is a very different proposition from one that admits 40% OOS and offers reclassification after year one. Run the four-year math before you commit a secondary fee.
One practical note on borderline profiles: if your GPA or MCAT sits below a school’s published median, a high OOS percentage does not compensate for that gap. The OOS-friendly schools on this list are not low-selectivity programs. Eastern Virginia Medical School, for instance, has median GPA and MCAT scores indicating moderate competitiveness. That’s a real bar. The OOS friendliness means the door is open to nonresidents who clear it, not that the bar is lower.
Medschoolpilot keeps your OOS school list from falling apart
Tracking 12–18 schools across different residency rules, tuition structures, reclassification windows, and secondary deadlines is where most OOS application strategies break down. Not because the strategy is wrong, but because the logistics overwhelm a spreadsheet.
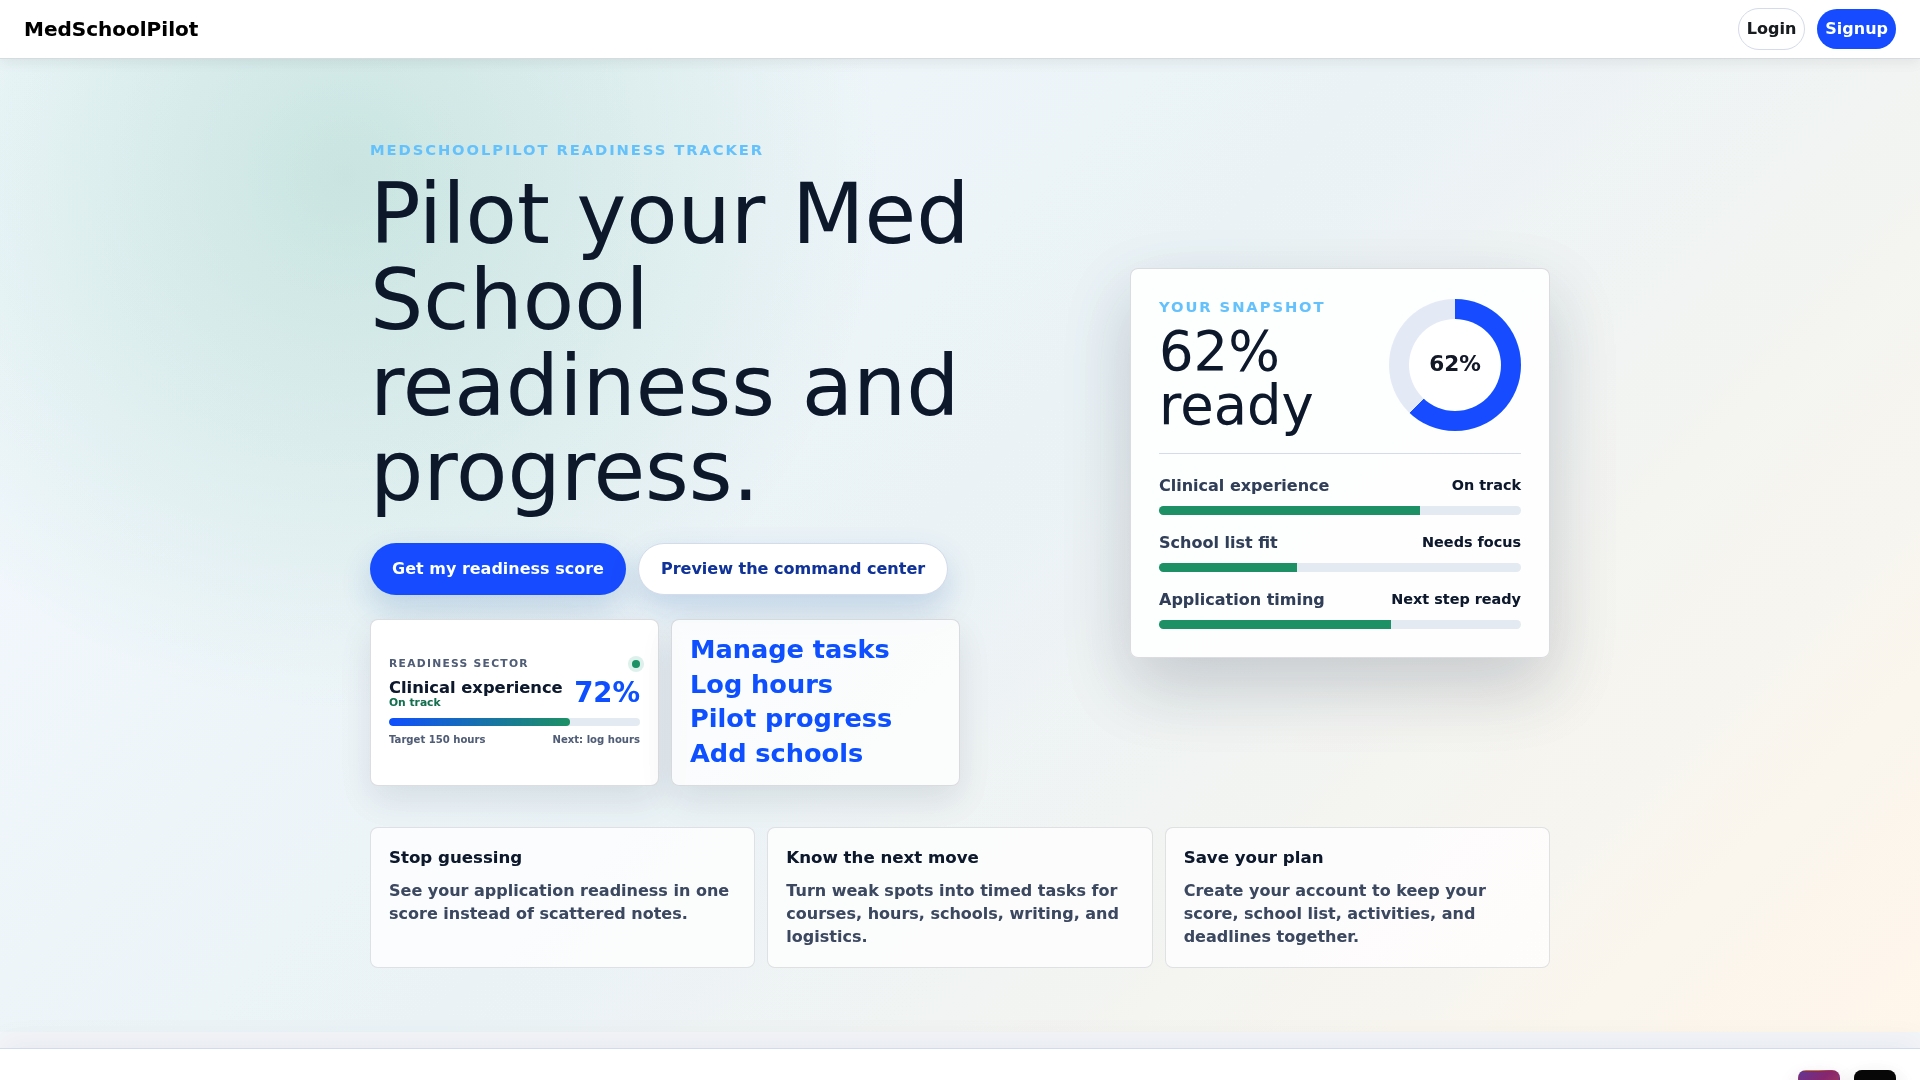
Medschoolpilot is built for exactly this problem. The platform lets you build and manage your school list with notes on residency status, OOS tuition, and reclassification eligibility alongside your readiness score, clinical hours, and task timelines. Everything lives in one workspace, so a reclassification deadline or a scholarship cutoff doesn’t get buried in a tab you forgot to check.
For OOS applicants specifically, the readiness tracker helps you score each target by fit and realistic admit probability, not just by whether the school admits nonresidents. You can log your clinical and volunteer hours alongside school-specific notes, which matters when you’re building a secondary that argues mission fit.
Start your free access at MedSchoolPilot and add your OOS shortlist today.
Authoritative sources for OOS figures and class profiles
When you’re building or verifying your list, go to primary sources. Here’s where to look and what to query.
- MSAR (AAMC Medical School Admissions Requirements) at aamc.org: search by school, then look for “matriculant state of legal residence” and “entering class profile.” This is the most reliable single source for OOS percentages. Requires a paid subscription.
- Individual school admissions pages: search “[School Name] class profile [year].” Most LCME-accredited schools publish an annual PDF or web page with a state-of-residence breakdown. Look for the most recent class year and record it in your tracker with the date.
- School bursar and financial aid pages: for OOS tuition rates and residency reclassification policies, go directly to the school’s financial aid or bursar office page. Third-party summaries go out of date quickly.
- SmarterPremed OOS Welcome Mat: a free aggregator tool that surfaces OOS percentages and flags anomalies. Useful for a quick first pass, but always verify the underlying figure against the school’s own class profile before acting on it.
- ProspectiveDoctor and Premed Catalyst: both publish curated OOS-friendly lists with source citations. Useful for discovery, but check the methodology note and the data year on any percentage they quote.
For every school you add to your list, record three things: the OOS percentage, the source (MSAR, class profile, or aggregator), and the class year the figure comes from. A number without a year is nearly useless when cycles shift.